The Profitability Revolution: Why POAS is the New North Star for 2026
The Shift: Moving Beyond Revenue-Only Metrics
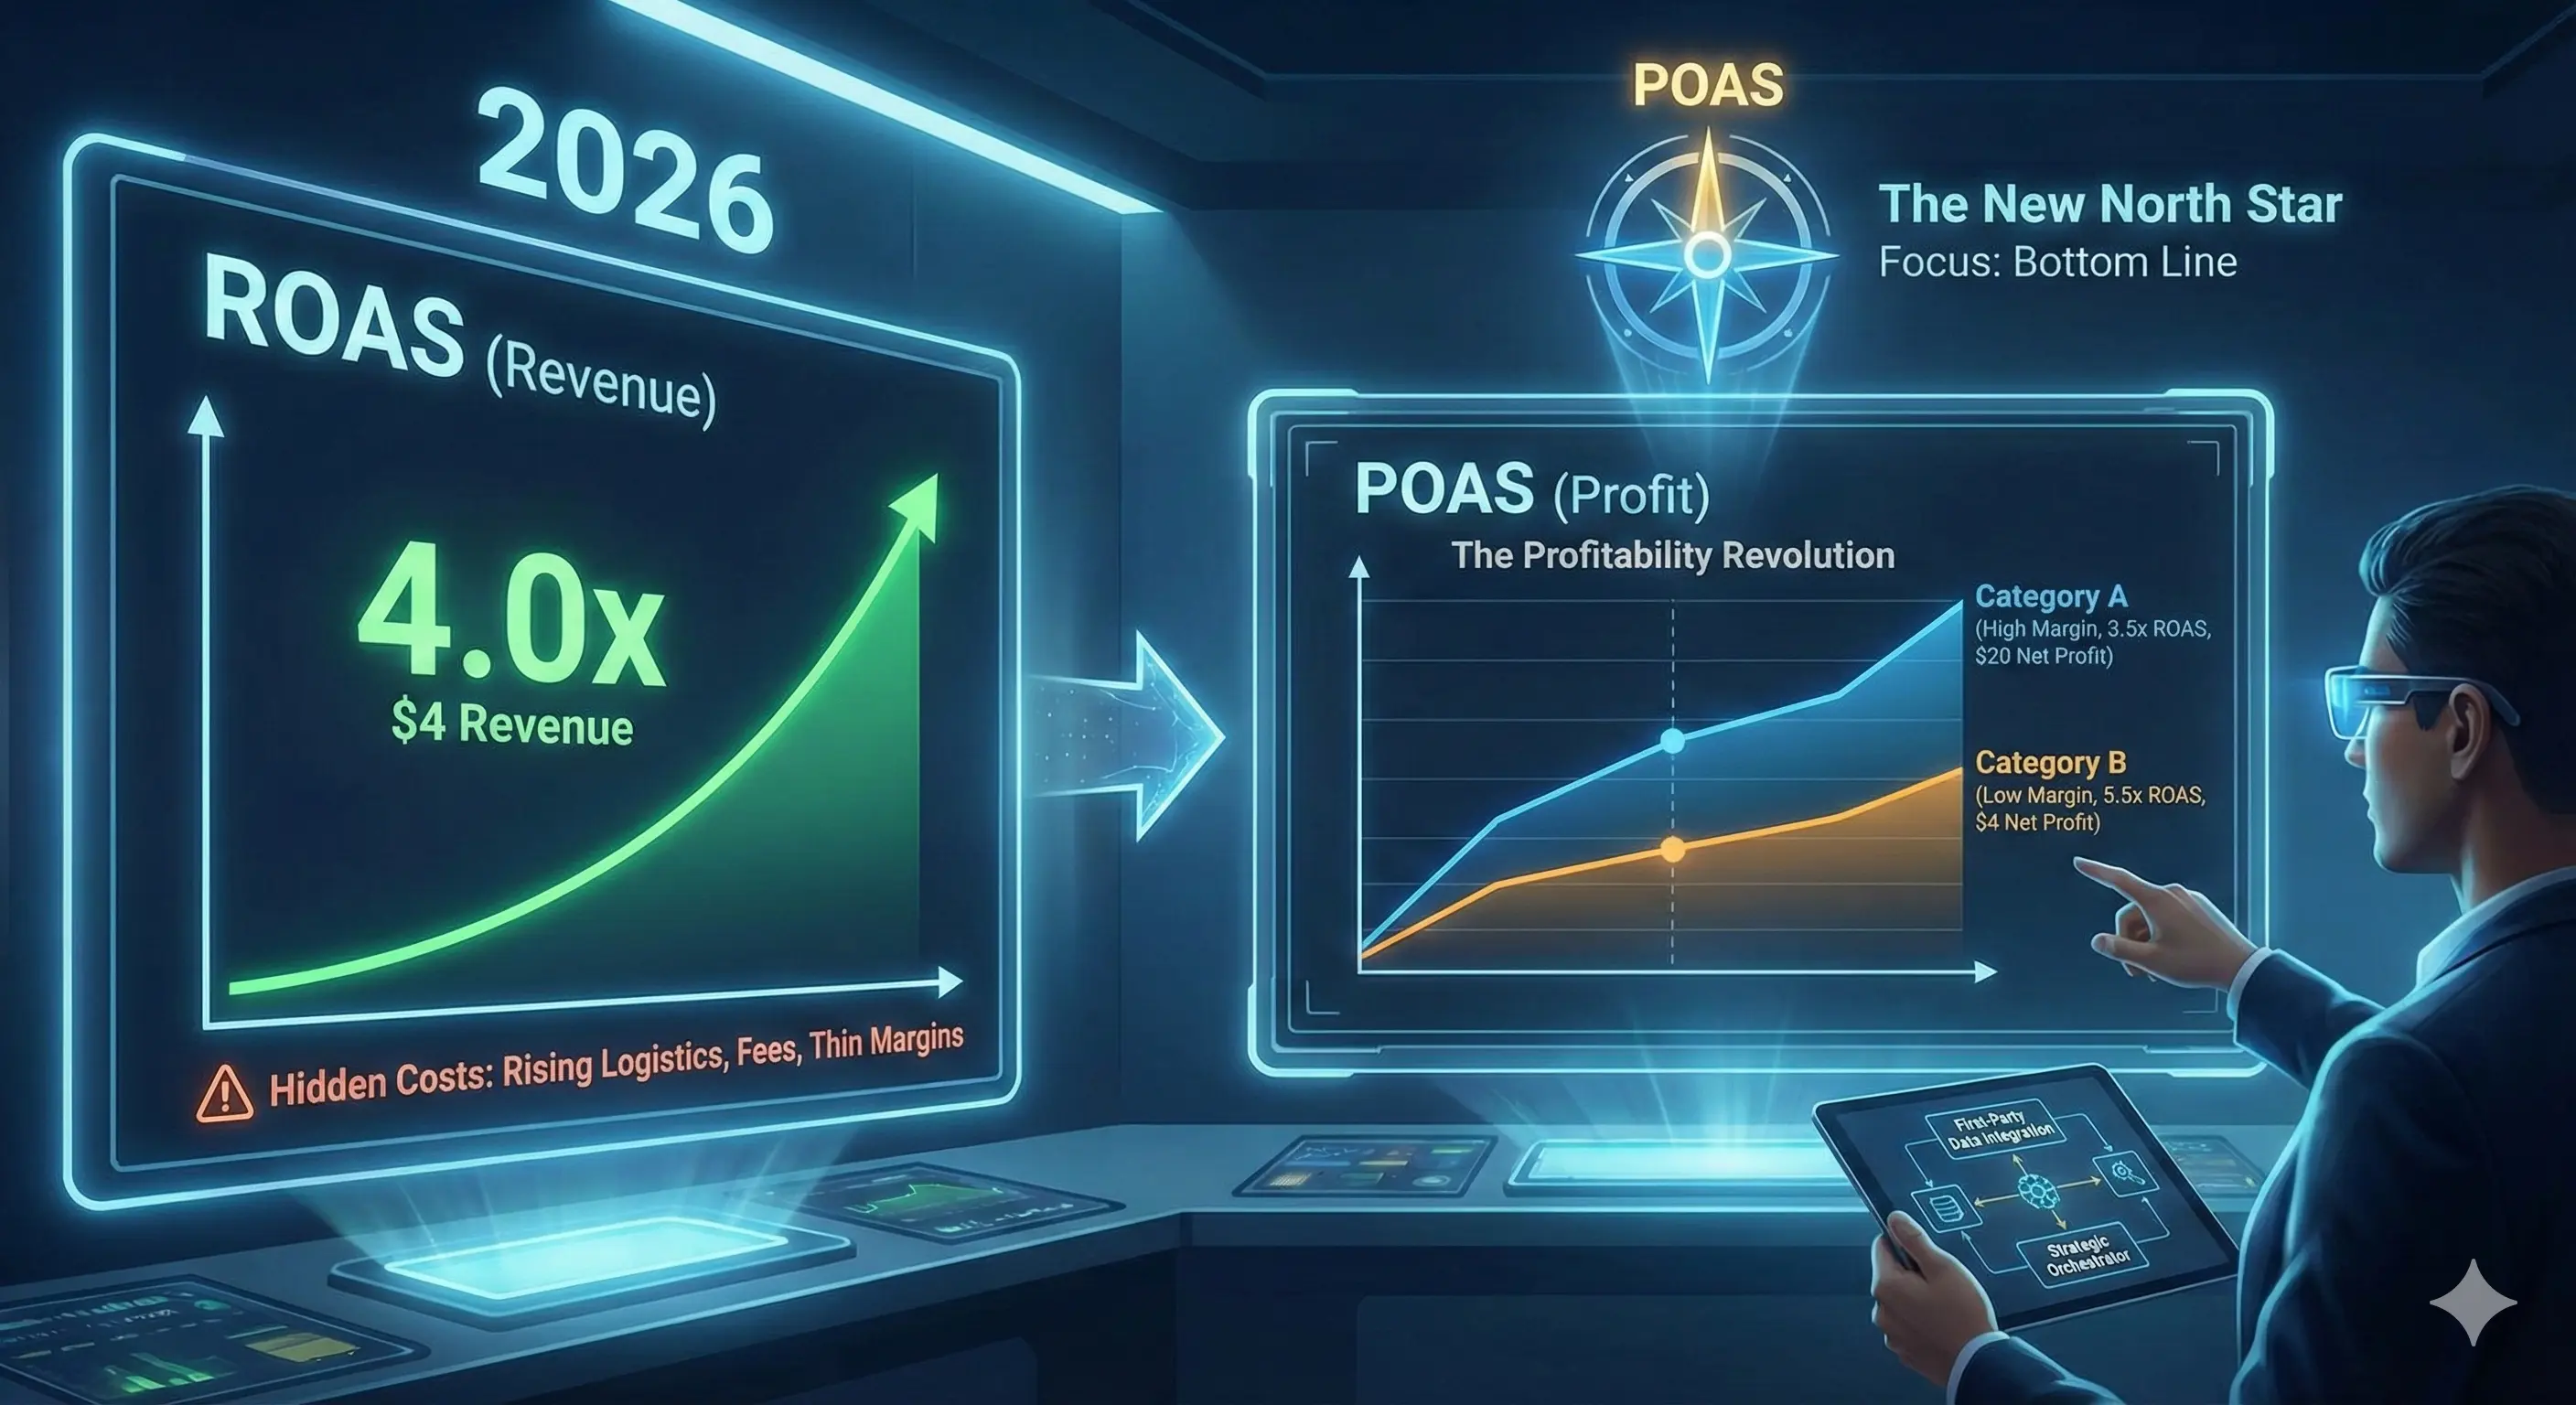
For years, the digital marketing world lived and died by ROAS (Return on Ad Spend). It was simple: you spend $1, you make $4 back, everyone is happy.
But in 2026, the landscape has changed. With rising logistics costs, higher platform fees, and fluctuating product margins, a 4.0x ROAS in your Meta dashboard can actually hide a campaign that is losing money.
This is why top-tier agencies and consultants have shifted their focus to POAS (Profit on Ad Spend).
📈 ROAS vs. POAS: Knowing the Difference
Think of it this way: ROAS measures the efficiency of your ads, but POAS measures the health of your business.
- ROAS (Return on Ad Spend): Focuses on top-line revenue. It tells you how much the algorithm is generating per dollar spent.
- POAS (Profit on Ad Spend): Focuses on the bottom line. It subtracts your COGS (Cost of Goods Sold), shipping, and fees before measuring the return.
Why the ROAS Metric Still Matters
Even as we move toward profit-focused modeling, ROAS is still your primary lever for the AI algorithms. Platforms like Meta's Advantage+ and Google's PMax still optimize for "Conversion Value." To keep these algorithms fed with the right data, you must understand your Break-Even ROAS.
🧪 The "I Analyzed This" Moment: The 12% Profit Gap
I recently ran a profitability audit using our ROAS & Break-Even Tool for an e-commerce brand that felt their scaling had 'stalled.'
They were aiming for a 5.0x ROAS across the board. When we looked at their POAS, we found a massive discrepancy:
- Category A (High Margin): At a 3.5x ROAS, they were making a $20 net profit per order.
- Category B (Low Margin): At a 5.5x ROAS, they were only making a $4 net profit per order.
The Analysis: The brand was accidentally starving their most profitable products because they were obsessed with a "pretty" ROAS number. By lowering their ROAS target on Category A, we allowed the AI to scale, resulting in a 15% increase in total net profit even though the "average ROAS" on the dashboard looked worse.
How to Balance ROAS and POAS in 2026
If you're deciding how to structure your reporting, use this framework:
| Scenario | Use ROAS To... | Use POAS To... |
|---|---|---|
| Daily Bidding | Feed the algorithm signals. | Verify the day's profitability. |
| Scaling Decisions | Find the "Scaling Ceiling." | Protect your cash flow. |
| Agency Reporting | Audit technical efficiency. | Audit business growth. |
| New Launches | Test market resonance. | Set the "Safety Zone" price. |
Should I hire an agency to manage POAS?
The Short Answer: Only if they are willing to integrate with your First-Party Data. Managing POAS requires a consultant who understands your P&L, not just your Ad Manager. This is the difference between a "Tactical Executioner" and a Strategic Orchestrator.
Frequently Asked Questions
Q: Is a high ROAS always better? A: No. In 2026, a high ROAS can be misleading if your product margins are thin or your shipping costs are high. You should always cross-reference your Break-Even ROAS with your actual profit margins to ensure sustainability.
Q: What is a good POAS target? A: A POAS of 1.0 means you are exactly breaking even (you made $1 in profit for every $1 spent). Most profitable brands aim for a POAS of 1.5 to 2.5, depending on their growth stage and customer lifetime value (LTV).
The Bottom Line
Don't let a "green" dashboard trick you into scaling a failing business. In 2026, you need to be a mathematician first and a marketer second. Use ROAS to talk to the AI, but use POAS to talk to your bank account.
Ready to find your "Safety Zone"? Use our Advanced ROAS Calculator to calculate your exact break-even point before you spend another dollar on ads.